Ambeone Student’s Projects Gallery
Based on the Big Data Analytics & Machine Learning Techniques taught in Ambeone’s Programs
This is a Gallery of some glimpses Data Science projects done by recent Ambeone students as part of their program.In case you are interested to know more about a particular project/projects, you may contact us for details .

Bank Marketing Data Analysis
Submitted by: Sonia

Bank Marketing Data Analysis Model Using Data Science
Overview
The Bank Marketing Data Analysis Model was developed using Data Science. The data is related to direct marketing campaigns (phone calls) of a Portuguese banking institution.
Objective
The classification goal is to predict if the client will subscribe to a term deposit.
Data Preparation & Processing
- Datasets of a Portuguese Banking Institution was collected
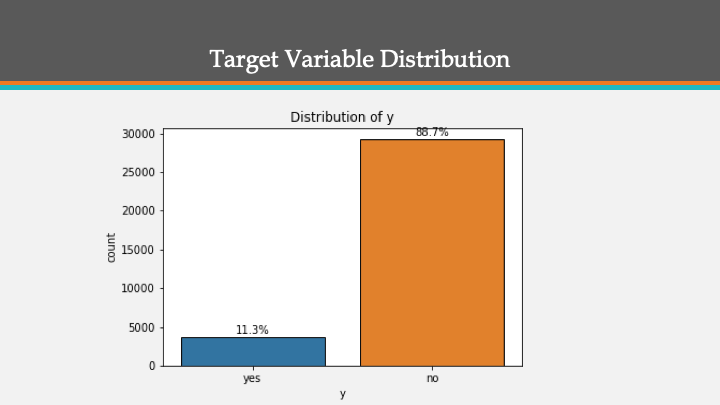
- Target Variable Distribution was found
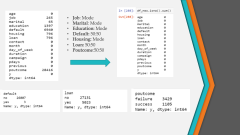
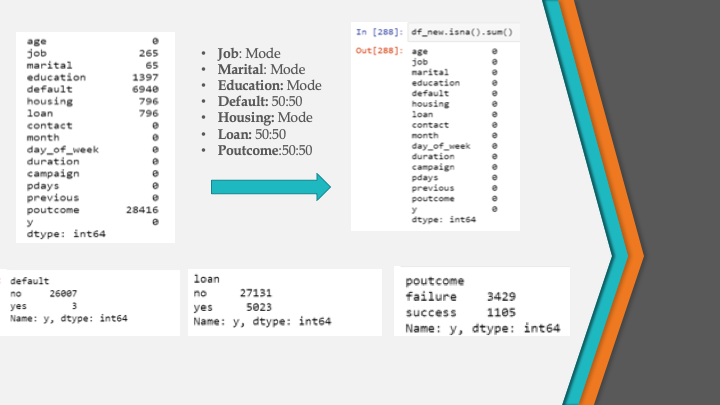
- Missing Values and Imputation were checked
- Visualization was carried out on the basis of Job, Marital, Education, Default, Housing, Loan, Contact, Month
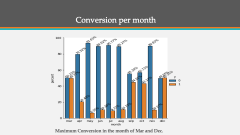
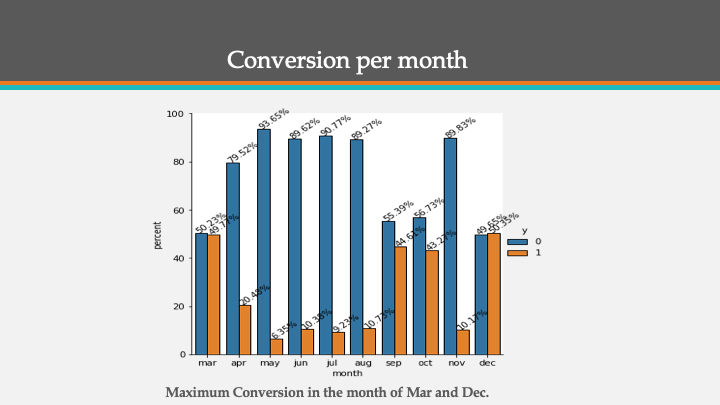
- Conversions per month, week and day were analyzed
- Outcome was derived
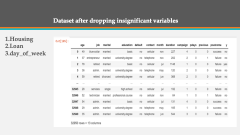
- Dropping variables were found out
- Encoding was performed
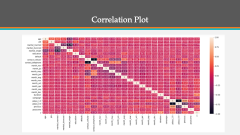
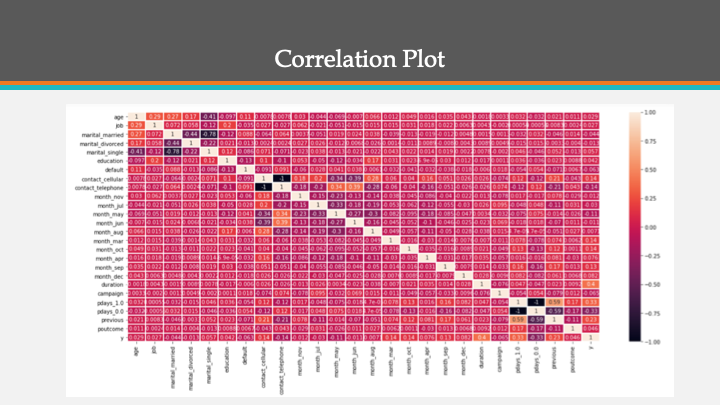
- Correlation matrix was plotted
Data Science Techniques and Models used
- Classification
- Visualization
- Dropping Variables
- Encoding
Key Results
- The P Value is less than 0.05, that indicates “JOB” is a significant variable to predict “y”.
- The P Value is less than 0.05, that indicates “Marital” is a significant variable to predict “y”.
- The P Value is less than 0.05, that indicates “Education” is a significant variable to predict “y”.
- The P Value is less than 0.05, that indicates “Default” is a significant variable to predict “y”.
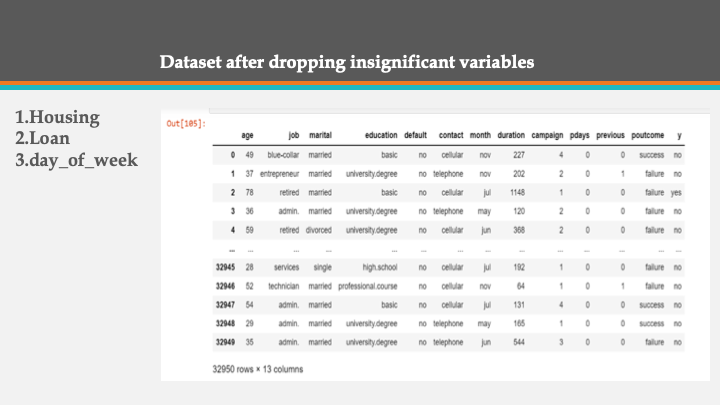
- The P Value is more than 0.05, that indicates “Housing” is independent of “y”. Therefore, not a significant Variable in the prediction of “y”.
- The P Value is more than 0.05, that indicates “Loan” is independent of “y”. Therefore, not a significant Variable in the prediction of “y”.
- The P Value is less than 0.05, that indicates “Contact” is a significant variable to predict “y”.
- The P Value is less than 0.05, that indicates “Month” is a significant variable to predict “y”.
- The P Value is more than 0.05, that indicates “day of week” is independent of “y”. Therefore, not a significant Variable in the prediction of “y”.
- The P Value is less than 0.05, that indicates “Poutcome” is a significant variable to predict “y”.
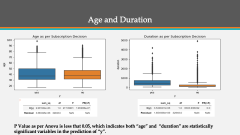
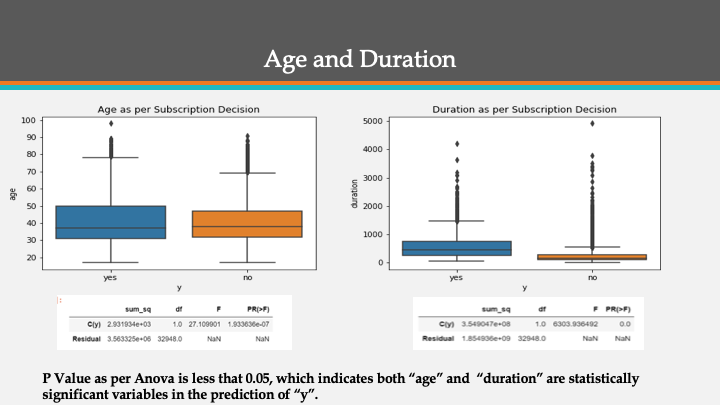
- P Value as per Anova is less than 0.05, which indicates both “age” and “duration” are statistically significant variables in the prediction of “y”.
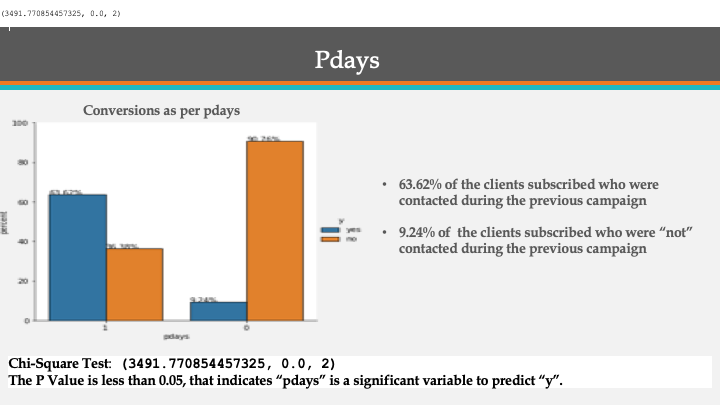
- P Value as per Anova is less than 0.05 for Campaign, which indicates “campaign” is a significant variables in the prediction of “y”. There are 31724 out of 32950 are “999” which means the client was not at all contacted before. Therefore, due to insufficient data, “pdays” is not a significant variable for this prediction.
- Conversion as per days
- 63.62% of the clients subscribed who were contacted during the previous campaign
- 9.24% of the clients subscribed who were “not” contacted during the previous campaign
- P Value as per Anova is less than 0.05, which indicates both “age” and “duration” are statistically significant variables in the prediction of “y”.
[