Interactive Graphs made with R
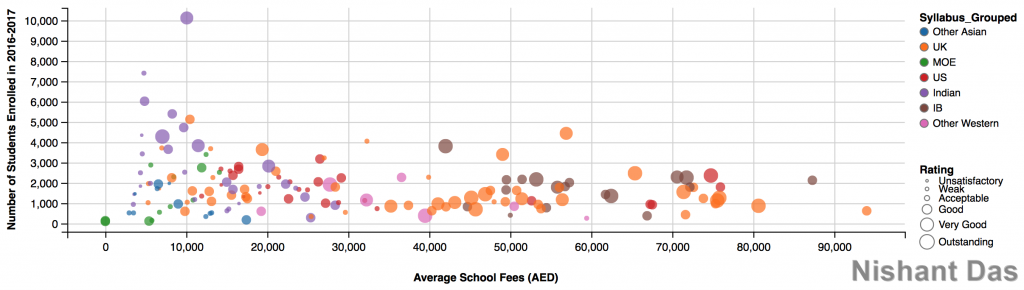
The following graphs were made with R on open-datasets shared by the Knowledge & Human Development Authority (KHDA) of Dubai, U.A.E.
These graphs cannot be used without written permission of the author.

The following graphs were made with R on open-datasets shared by the Knowledge & Human Development Authority (KHDA) of Dubai, U.A.E.
These graphs cannot be used without written permission of the author.

Nishant Das is a Data Scientist & Consultant at Marketways Arabia. He has over 7 years of experience as a management consultant, working with clients gain the edge through customized data analysis.
He is passionate about Big Data Analytics with a focus on Machine Learning, Predictive Modeling & Data Visualization using languages such R, Python, Scala, etc. He believes the key to leverage the power that lies within data is asking the right questions.
Nishant holds a Bachelors degree in Engineering from McMaster University, Canada with a specialization in Engineering Physics (Nuclear Engineering & Renewable Energy).
He can be contacted on thenishantdas@gmail.com