
Kindly contact Nishant Das at thenishantdas@gmail.com for more information. To learn how to conduct advanced data analytics & make interactive graphs click here.
Every year the Knowledge & Human Development Authority of Dubai (KHDA), as part of their drive to ensure highest quality of education being provided in Dubai, conduct quality assurance inspections of all schools operating in Dubai and ranks each school based on a strict & clearly defined criteria. [1]
Data Source
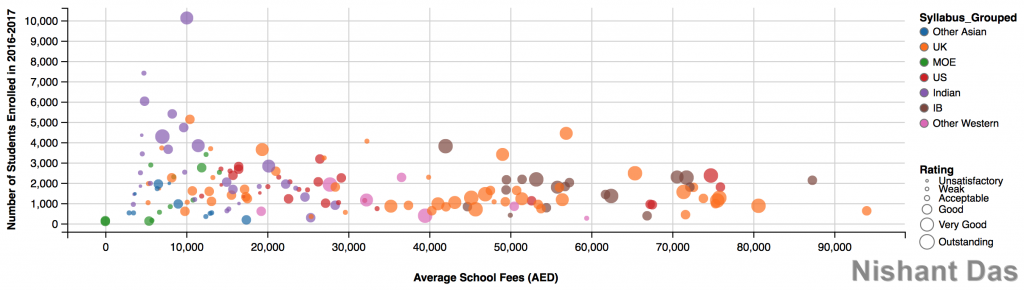
KHDA shares data for each school along with their annual inspection reports.The datasets for our analysis was downloaded from the KHDA website [2]. The data set included diverse data for all Dubai schools from previous years with following attributes.
Syllabus/curriculum of each school
Annual KHDA Ranking Scores
Fees Structure for all grades over the years
Number of students Enrolled over the years
Type of School (For-Profit, Non-Profit, etc.)
Location of each school in Dubai
Based on KHDA data and using open-source big data analytics languages such as R, we applied a range of tools & techniques to process the data and extract interesting trends & correlations.
The analysis was driven to answer key questions. Some of these include,
1- What factors drive school fees?
- Is it the school curriculum, location, the number of students enrolled or a combination of these factors?
- We use correlation analysis to determine which factors play a role in driving school fees.
- We use predictive modeling to predict school fees in the coming years.
2- Does higher school fees imply better KHDA ratings?
- Hint : Not necessarily, in fact there are some cluster of schools whose ranking decreases as the school’s fees increases! So paying a higher fees does not guarantee the best education for students.
- For parents who want to get the best quality of education for their children, we have identified characteristics of schools that generally lead to higher (or lower) KHDA rankings.
- We use machine learning concepts like cluster analysis and classification analysis to answer these questions.
3- Is KHDA’s quality control and ranking improving the educational industries service delivery since it was launched?
- Can we quantify these improvements?
- Can we predict school ranking’s for the coming year?
- We use linear regression modeling and some tricky data acrobatics to answer this question.
4- Many, many other interesting questions! Stay tuned for more.
The aim of this study is two fold:
- Provide key insights that can be used by parents, school administrators and investors to see what is the current school landscape like, what factors lead to better quality of service and what opportunities exist to improve the quality of education for Dubai’s students!
Showcase the power of advanced data analytics, machine learning, predictive modeling & advanced data visualization. Using languages like R & Python make such analysis a breeze. These scripting languages seamlessly combine the power of data cleaning, data mining, data manipulation, statistical modeling & visualization which enables for quick ad-hoc analysis. Spreadsheets, BI tools, etc. and other standard industry solutions just can’t keep up!
Based on KHDA Open-data and using open-source big data analytics languages such as R, we applied a range of tools & techniques to process the data and extract interesting trends & correlations.
Some tools used include:
- Advanced data cleaning & structuring using tidyR.
- Advanced data manipulation using dplyr.
- Interactive data visualization using ggplot2, plotly, shiny & ggvis.
- Statistical & Machine Learning techniques such as Linear Regression Modeling, Classification, Cluster Analysis, Time Series Analysis, etc.